



Analysing your email marketing statistics helps you spot opportunities to improve. Knowing whether youremail marketing strategy is paying off starts with a simple but crucial comparison: where you stand against the market average. According to 2025 data, the average open rate across all industries is roughly 20–27% and the click-through rate (CTR) is 2–3%. The figures vary noticeably depending on the source and the method, mainly because Apple Mail Privacy Protection records opens that never actually happened. If your email marketing campaigns fall short of these numbers, it is a sign that you need to review your content, your subject lines or the quality of your newsletter mailing list straight away.
These statistics matter for more than the numbers themselves: they reveal the quality of your relationship with your audience. In modern digital marketing, where competition in the inbox is huge, knowing your industry’s benchmarks is the first step towards improving your ROI (return on investment). For example, while an online shop may count a 20% open rate as a success, a B2B services company often aims for more than 30% before it considers a campaign effective. On top of that, factors such as sending frequency and the use of automation can raise engagement rates by 50% or more, showing that a targeted approach beats mass communication.
Email marketing averages across all industries (2025–2026 data)
| Email KPI | Open rate | Click rate | Unsubscribes | Soft bounce | Hard bounce |
|---|---|---|---|---|---|
| Overall | 30.22% | 3.52% | 1% | 3.52% | 0.39% |

What is a soft bounce?
It is a temporary failure to deliver the email. It usually happens because the recipient’s mailbox is full. The system will try to send it again later
What is a hard bounce?
It is a permanent delivery failure. The email address is wrong or no longer exists. You should remove this contact from your list straight away.
What is open rate?
It is the percentage of recipients who opened your email. It mainly shows whether the subject line and the sender name were convincing. Note: with Apple Mail Privacy Protection, many opens are recorded automatically, so open rate is now best read as a trend indicator.
What is click-through rate?
It is the percentage of recipients who clicked a link in the email. It shows whether the content and the offer persuaded them to take the next step. It is a more reliable metric than open rate, because Apple MPP does not affect it.
Now that we have covered the basic numbers and terms, let’s look at the data in more detail.
Contents
Why benchmarks matter for your digital strategy
Tracking benchmarks is the only reliable way to find out whether your marketing is bringing real results or wasting resources. Without knowing your industry averages, a 20% open rate may look satisfactory when in reality it may lag well behind the competition, which in several industries sits higher
Benchmarks work like a compass, showing where your business stands against the wider market. When you know the average click-through rate is around 2–3% (and usually 1.5–3% in retail), you have a realistic target. If your rates are lower, the data points you to the root of the problem:
- A low open rate usually means a weak subject line or problems with your sender reputation.
- A low CTR suggests that the content or the visuals of the message are not appealing enough, or that the call to action (CTA) is not clear.
Privacy protection (Apple MPP) affects the metrics
In recent years, the reliability of open rate has been distorted by Apple’s Mail Privacy Protection (MPP). This setting preloads the tracking pixels in emails, making them appear “opened” even if the user never saw the message.
This has artificially inflated open statistics worldwide. That is why at WebMate we now advise our clients to focus more on click rate as the most honest measure of engagement. A click proves a conscious action and real interest from the user, which a simple open can no longer guarantee with the same accuracy.
Key performance indicators (KPIs)
To start with, let’s look at the figures by continent to get an overall picture.
- North America: Shows strong performance overall.
- EMEA (Europe, the Middle East and Africa): Has high user engagement, partly because of strict data protection laws.
- LATAM (Latin America) and APAC (Asia-Pacific): Offer opportunities for growth.

| Region | Opens | Clicks | Unsubscribes | Soft bounce | Hard bounce |
|---|---|---|---|---|---|
| North America | 29.42% | 3.38% | 0.40% | 4.19% | 0.22% |
| APAC | 25.84% | 3.07% | 0.33% | 5.38% | 0.24% |
| EMEA | 35.21% | 4.05% | 0.42% | 3.59% | 0.18% |
| LATAM | 25.32% | 2.91% | 0.21% | 3.91% | 0.24% |
High-performing industries
According to 2025 figures, the public administration sector leads in clicks (CTR), which makes sense when you think about it, because citizens see the content as important. Non-profit organisations follow, with high open rates and the fewest unsubscribes. Meanwhile, the culture and tourism sectors show the fewest delivery failures (hard bounces), a sign that they manage their lists well.
| Type | Opens | Clicks | Unsubscribes | Soft bounce | Hard bounce |
|---|---|---|---|---|---|
| Government | 46.94% | 3.87% | 8.24% | 0.10% | 0.37% |
| Nonprofits | 46.49% | 3.78% | 8.14% | 0.17% | 0.42% |
| Religion | 44.24% | 5.11% | 11.54% | 0.17% | 0.31% |
| Blogs | 43.00% | 5.25% | 12.22% | 0.18% | 0.26% |
| Internet & telecoms | 40.52% | 4.89% | 12.06% | 0.06% | 0.18% |
Low-performing industries
According to the analysis, business services show the best picture, with the highest open rate (39.48%) and strong reliability. By contrast, the construction and games sectors face a serious problem, as they have the most unsubscribes because of poor targeting or irrelevant content. In clicks, construction and games lead with high rates, while business services have lower rates, as they focus mainly on information. Finally, construction shows many inactive email addresses, which can cause problems with getting their messages delivered.
| Type | Opens | Clicks | Unsubscribes | Soft bounce | Hard bounce |
|---|---|---|---|---|---|
| Business services | 39.48% | 1.10% | 2.79% | 0.17% | 0.27% |
| Ecommerce | 38.58% | 2.08% | 5.40% | 0.25% | 0.31% |
| Marketing | 33.62% | 2.02% | 6.00% | 0.18% | 0.21% |
| Games | 32.02% | 3.75% | 11.70% | 0.15% | 0.16% |
| Construction | 32.48% | 4.55% | 14.01% | 0.30% | 1.31% |

Days and times: when to send your newsletter
The short answer is this: Tuesdays and Wednesdays are considered the most effective days, with mornings around 10:00 am recording the highest open rates. However, following this rule blindly does not guarantee success, because competition at these times is now huge.
To get the best results, you need to take into account your audience’s lifestyle and the industry you work in.
The best days of the week for the highest open rate
The statistics show a clear preference among users for the middle of the week.
- Weekends: Although email volume is lower, open rates tend to drop. However, for an online shop (retail), Saturday can have a surprisingly high conversion rate, as consumers have more free time to shop.
- Tuesday and Wednesday: These two days consistently get the highest open and click rates. Users have cleared Monday’s workload and are more receptive to new messages.
- Thursday: An equally strong option, especially for B2B businesses, as it is close to the end of the week but people are still productive.
Statistic: Campaigns sent on a Tuesday get on average 12% more opens than those sent on a Friday afternoon.
The times with the highest click-through rate
The time you send is critical to whether your messages get read or get lost in the crowd.
- 10:00 am (the “golden” hour): Most users check their emails as soon as they get to the office or start their day. It is the ideal time for business updates and B2B communication.
- 3:00 pm – 4:00 pm: There is a second peak in the early afternoon. Users often take a break from work and tend to engage with emails about offers or lifestyle content.
- 6:00 pm – 7:00 pm: For consumer-facing (B2C) services, such as online shops, these hours work well, as users relax and browse on their mobile devices.
WebMate tip: Don’t guess. Use the “Send Time Optimization” tools that many platforms offer. They analyse when each subscriber usually opens their emails and send the message at the right moment for each user.
Cleaning your newsletter list for better deliverability and a higher open rate

Many business owners hesitate to delete contacts, believing that a bigger list is always better. In the reality of email marketing, the opposite is true: quality beats quantity.
Keeping inactive users or addresses that return errors (bounces) seriously harms your reputation as a sender (sender reputation). Email providers such as Gmail and Outlook watch how users interact with your messages. If you keep sending emails to people who don’t open them, the algorithms treat your content as unwanted (spam).
To ensure high deliverability (the rate at which your emails reach the inbox):
- Remove hard bounces: Delete every email that returns a permanent error straight away. A bounce rate above 2% is a “red flag” for providers.
- Manage inactive subscribers: Apply a removal policy for users who have not opened any email in the last 6 to 12 months.
- Re-engagement campaigns: Before removing them, try one last re-engagement campaign. If there is still no response, go ahead and remove them.
A clean list of 5,000 active users will always bring better results and more sales than a “polluted” list of 20,000 people.
In conclusion
Today, email marketing remains one of the most effective digital communication channels, offering an excellent return on investment (ROI) when it is done properly. However, as the benchmarks show, the landscape is changing. Simply sending mass messages is no longer enough to win the attention of an audience bombarded with information every day.
The statistics we have looked at, with average opens close to 30% and click-through rate at 2–3%, should be the minimum you expect: the starting point for your goals. Real success lies in adaptability:
- Instead of focusing only on open rates (which are affected by Apple MPP), put the emphasis on clicks and conversions.
- Invest time in cleaning your list to protect your domain’s reputation.
- Use automation to send the right message at the right time (e.g. Tuesday morning), increasing the chances of a purchase from your online shop or business.
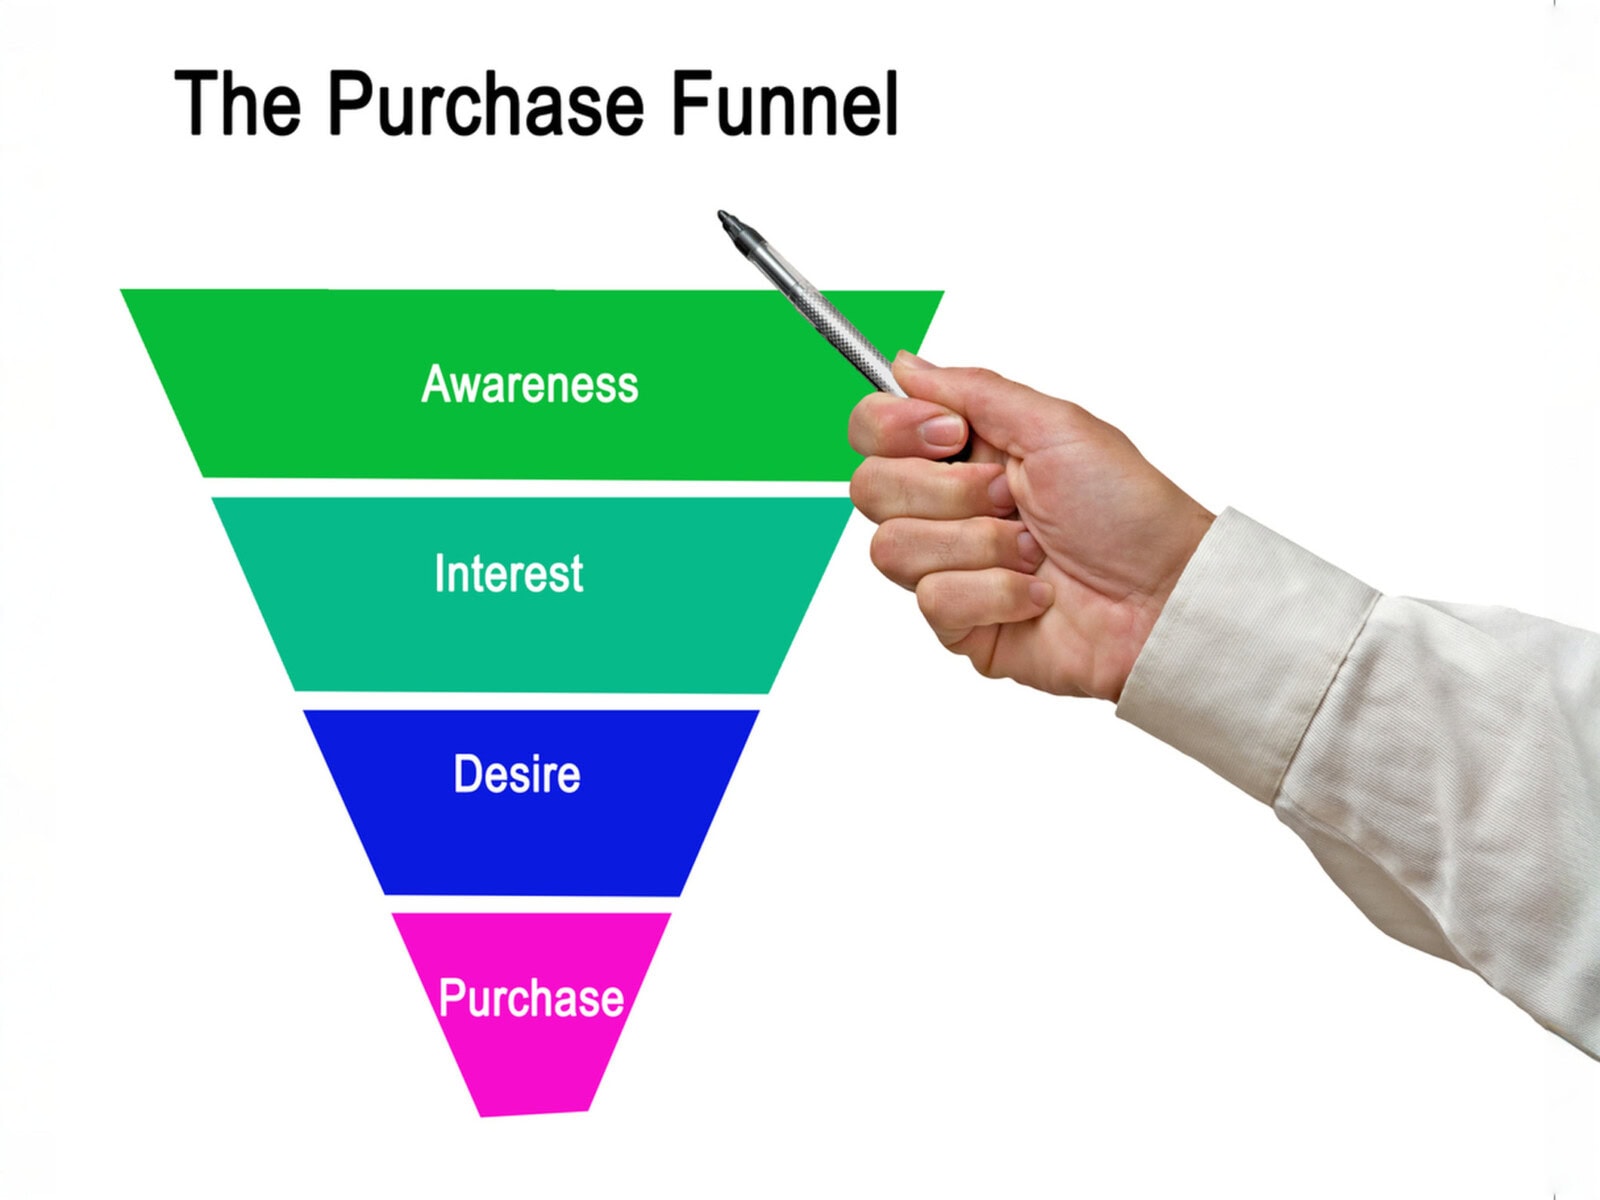
Every business is unique. Use this data to find where you are falling behind, experiment with A/B testing on your subject lines and content, and let the numbers guide your next strategic move. In modern digital marketing, knowing your numbers is power. And remember that email marketing should be built into, and structured around, your business’s funnel, whose goal is to sell a product or service.



Leave a comment